
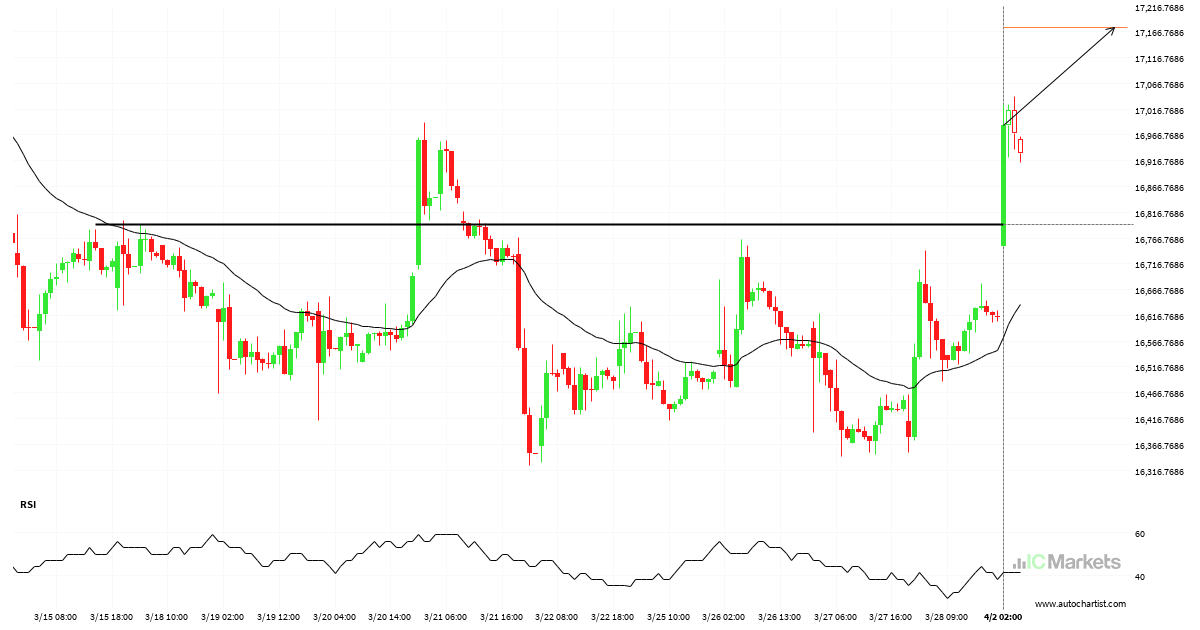
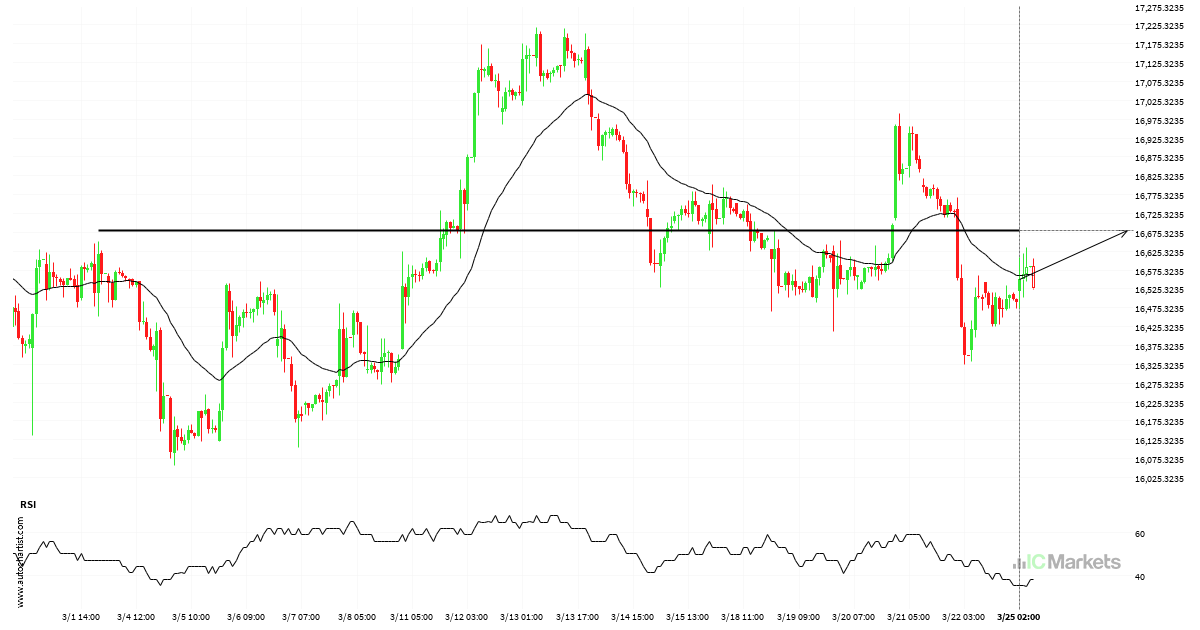
Hong Kong 50 Index breakout through resistance
A strong resistance level has been breached at 16793.1309 on the 1 hour Hong Kong 50 Index chart. Technical Analysis theory forecasts a movement to 17174.3691 in the next 2 days.
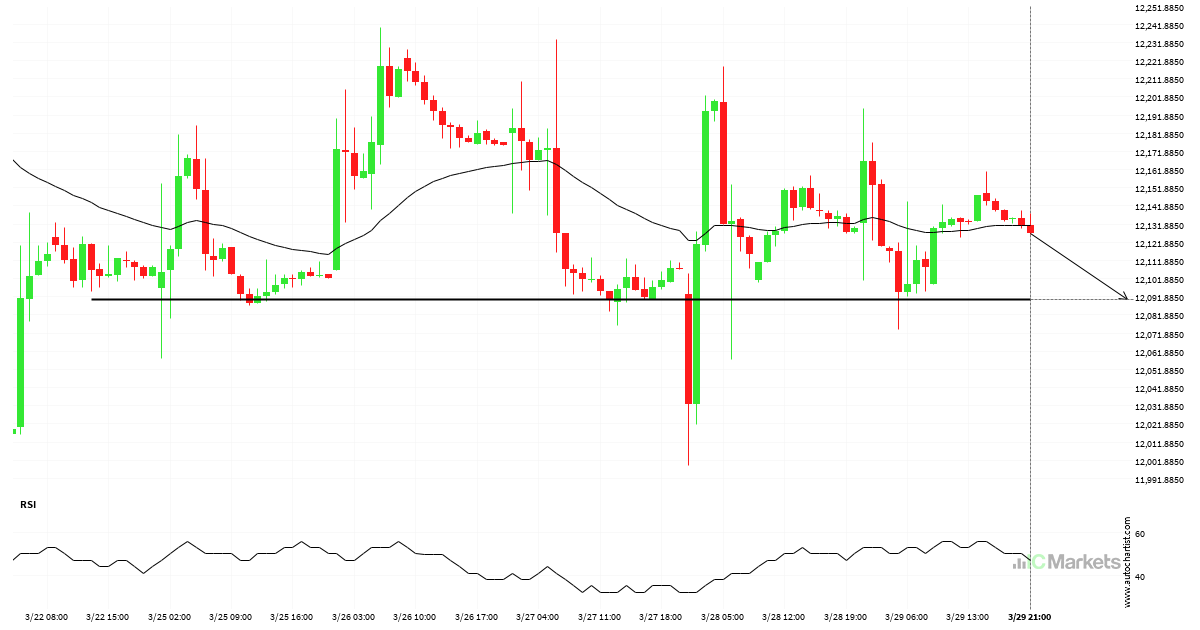
Should we expect a breakout or a rebound on FTSE China A50 Index?
FTSE China A50 Index is moving towards a support line. Because we have seen it retrace from this level in the past, we could see either a break through this line, or a rebound back to current levels. It has touched this line numerous times in the last 8 days and may test it again […]
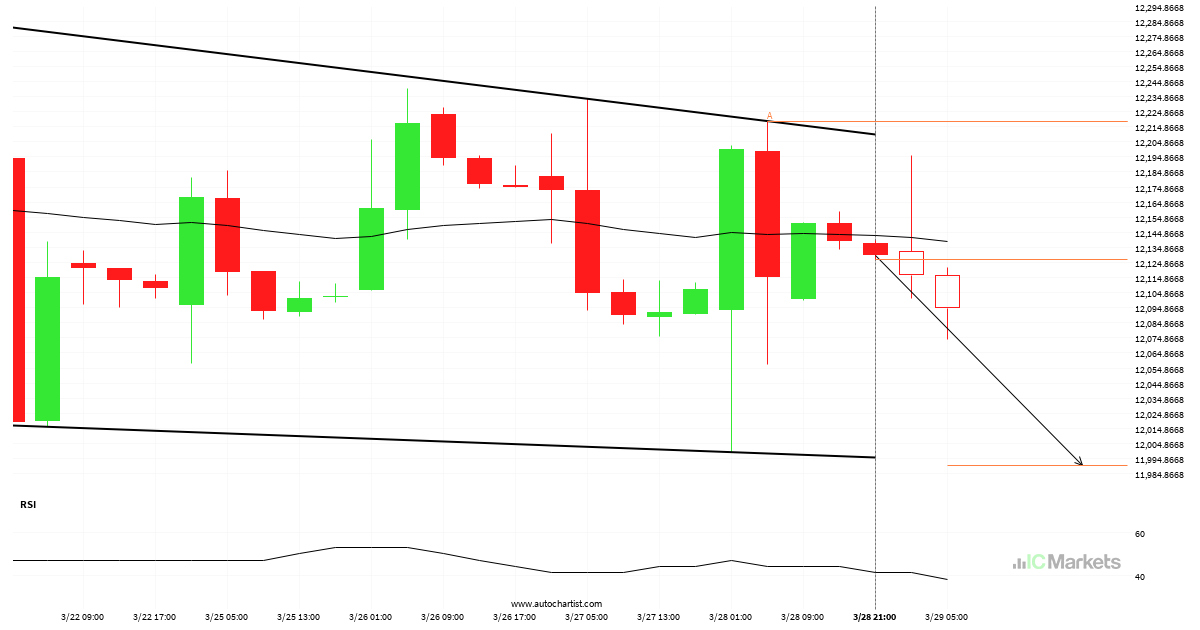
Should we expect a breakout or a rebound on FTSE China A50 Index?
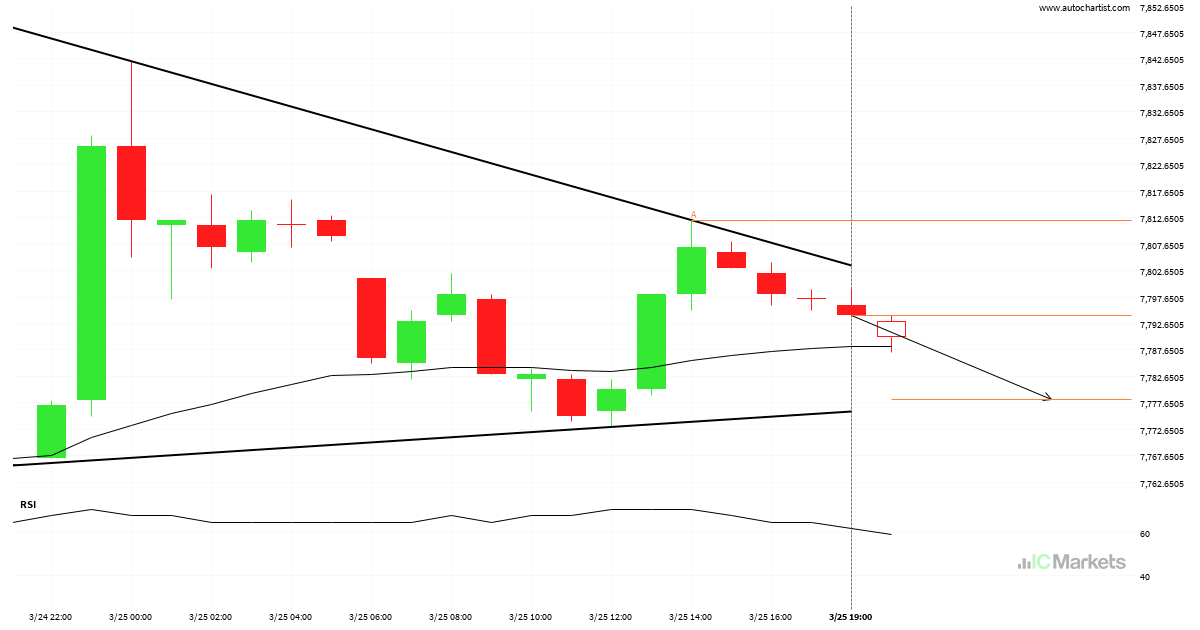
An emerging Descending Triangle has been detected on FTSE China A50 Index on the 4 hour chart. There is a possible move towards 11990.5187 next few candles. Once reaching resistance it may continue its bearish run or reverse back to current price levels.
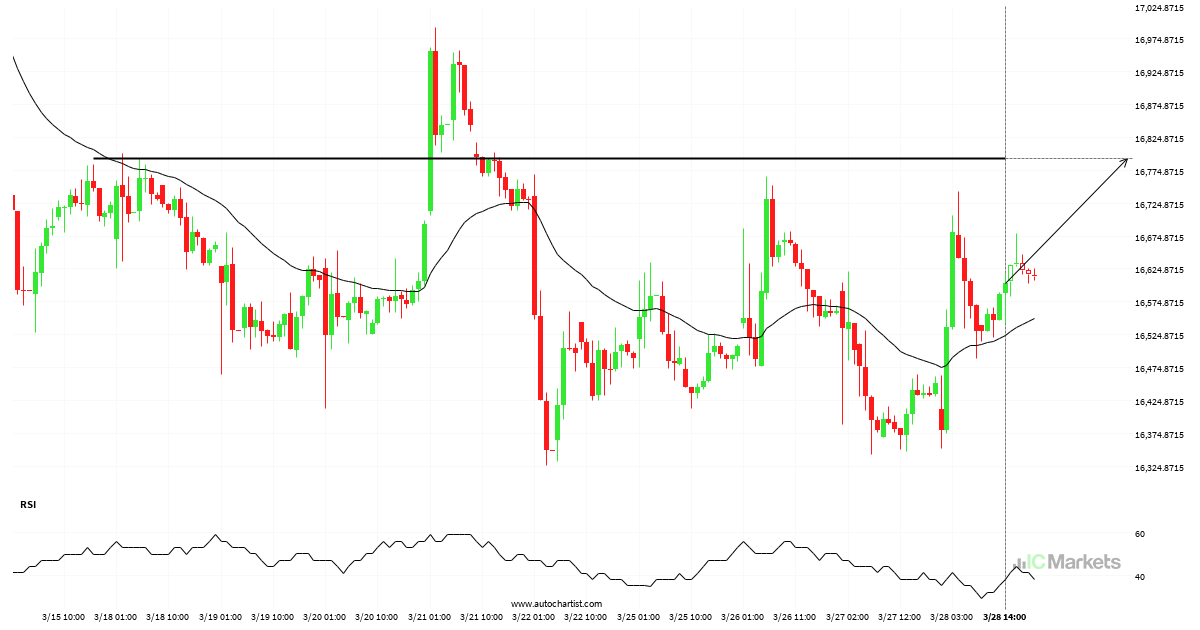
Hong Kong 50 Index approaching resistance level
Hong Kong 50 Index is moving towards a key resistance level at 16793.1309. Hong Kong 50 Index has previously tested this level 5 times and on each occasion it has bounced back off this level. Is this finally the time it will break through?
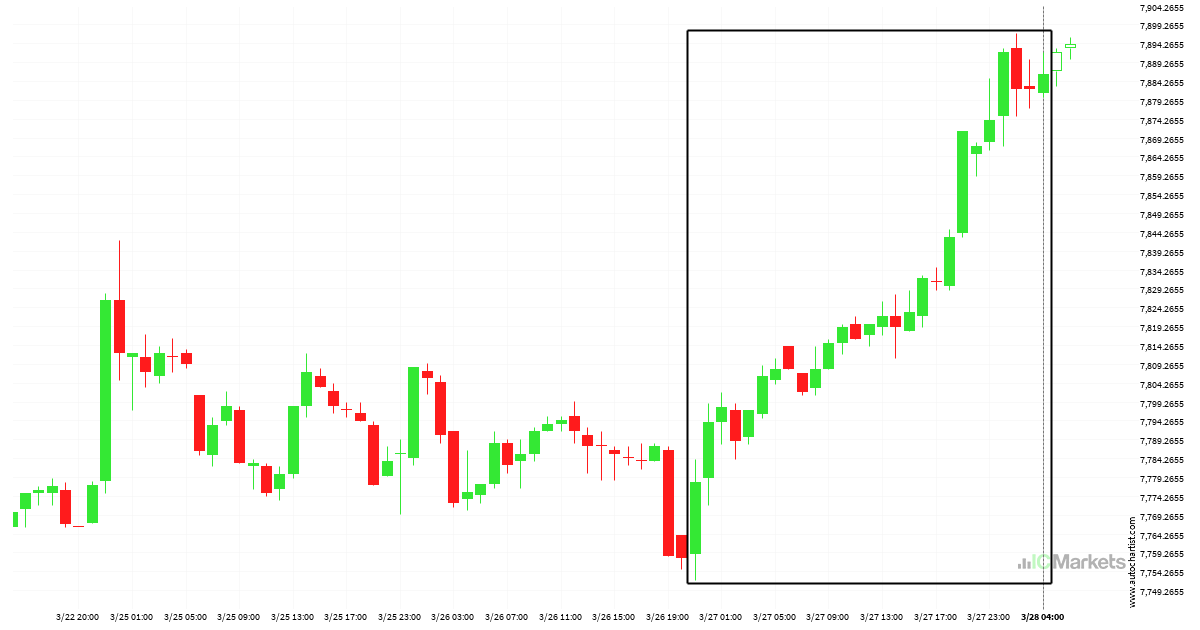
There was a bullish move on Australia 200 Index
Australia 200 Index rose sharply for day – which is an excessively big movement for this instrument; exceeding the 98% of past price moves. Even if this move is a sign of a new trend in Australia 200 Index there is a chance that we will witness a correction, no matter how brief.
Should we expect a breakout or a rebound on Australia 200 Index?
Australia 200 Index is heading towards the resistance line of a Rising Wedge and could reach this point within the next 3 days. It has tested this line numerous times in the past, and this time could be no different from the past, ending in a rebound instead of a breakout. If the breakout doesn’t […]
Australia 200 Index – Continuation Chart Pattern – Triangle
Australia 200 Index is moving towards a support line which it has tested numerous times in the past. We have seen it retrace from this line before, so at this stage it isn’t clear whether it will breach this line or rebound as it did before. If Australia 200 Index continues in its current trajectory, […]
Hong Kong 50 Index is on the approach
Hong Kong 50 Index is moving towards a resistance line. Because we have seen it retrace from this level in the past, we could see either a break through this line, or a rebound back to current levels. It has touched this line numerous times in the last 22 days and may test it again […]
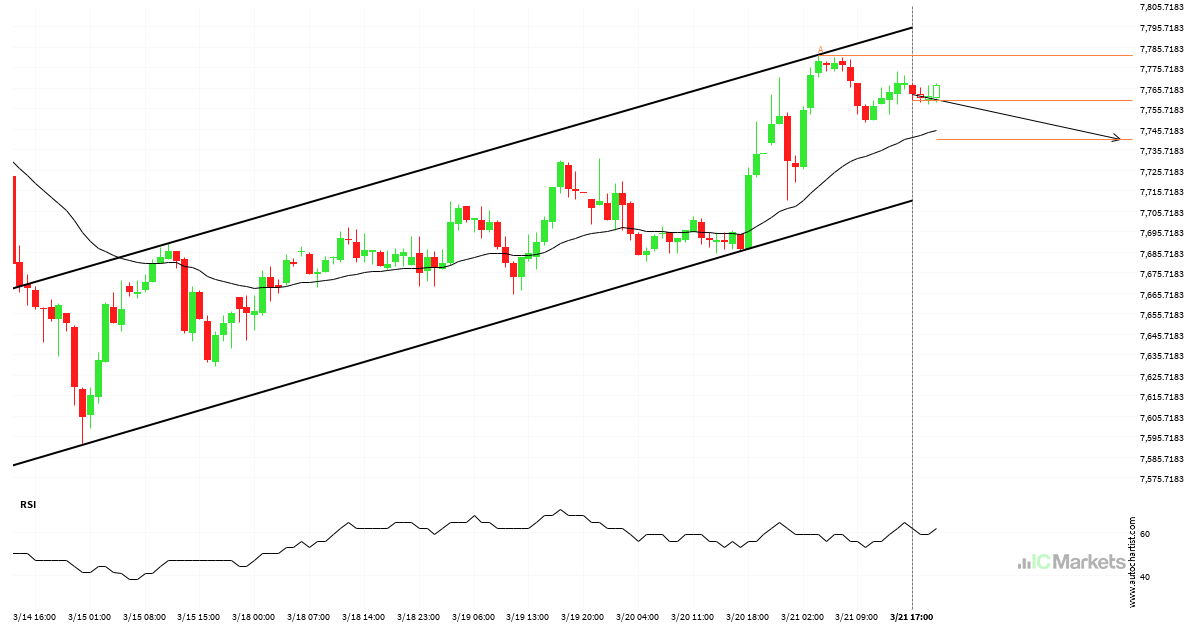
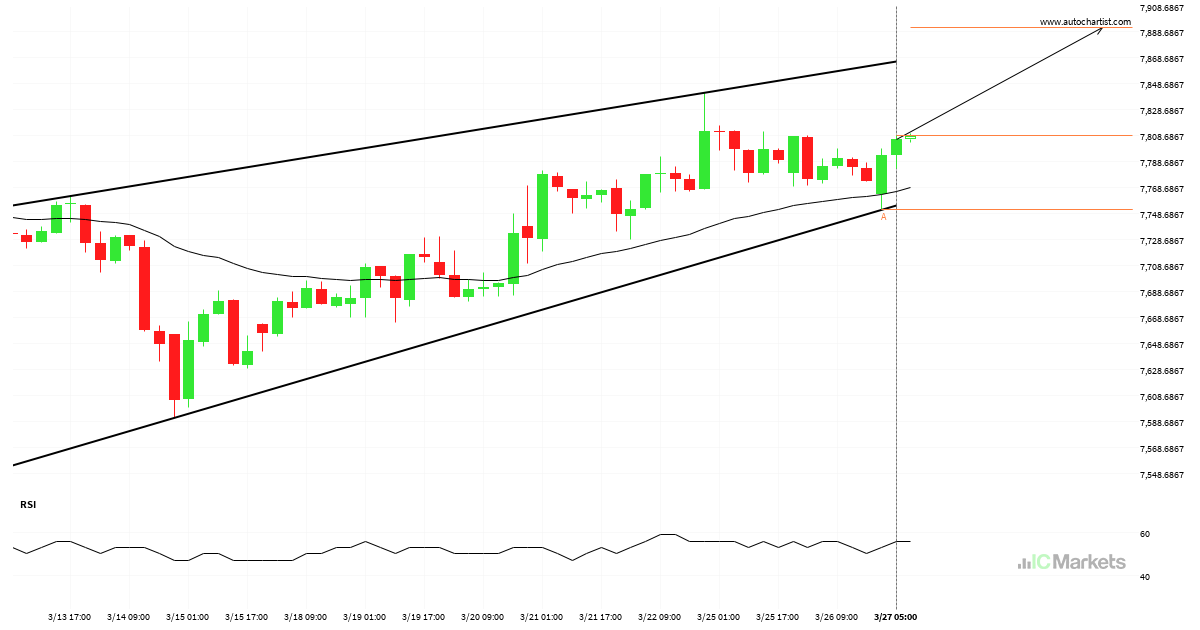
Australia 200 Index – Continuation Chart Pattern – Channel Up
An emerging Channel Up has been detected on Australia 200 Index on the 1 hour chart. There is a possible move towards 7740.4491 next few candles. Once reaching resistance it may continue its bearish run or reverse back to current price levels.

Either a rebound or a breakout imminent on Hong Kong 50 Index
Hong Kong 50 Index is moving towards a resistance line. Because we have seen it retrace from this level in the past, we could see either a break through this line, or a rebound back to current levels. It has touched this line numerous times in the last 6 days and may test it again […]